Solutions and services we support
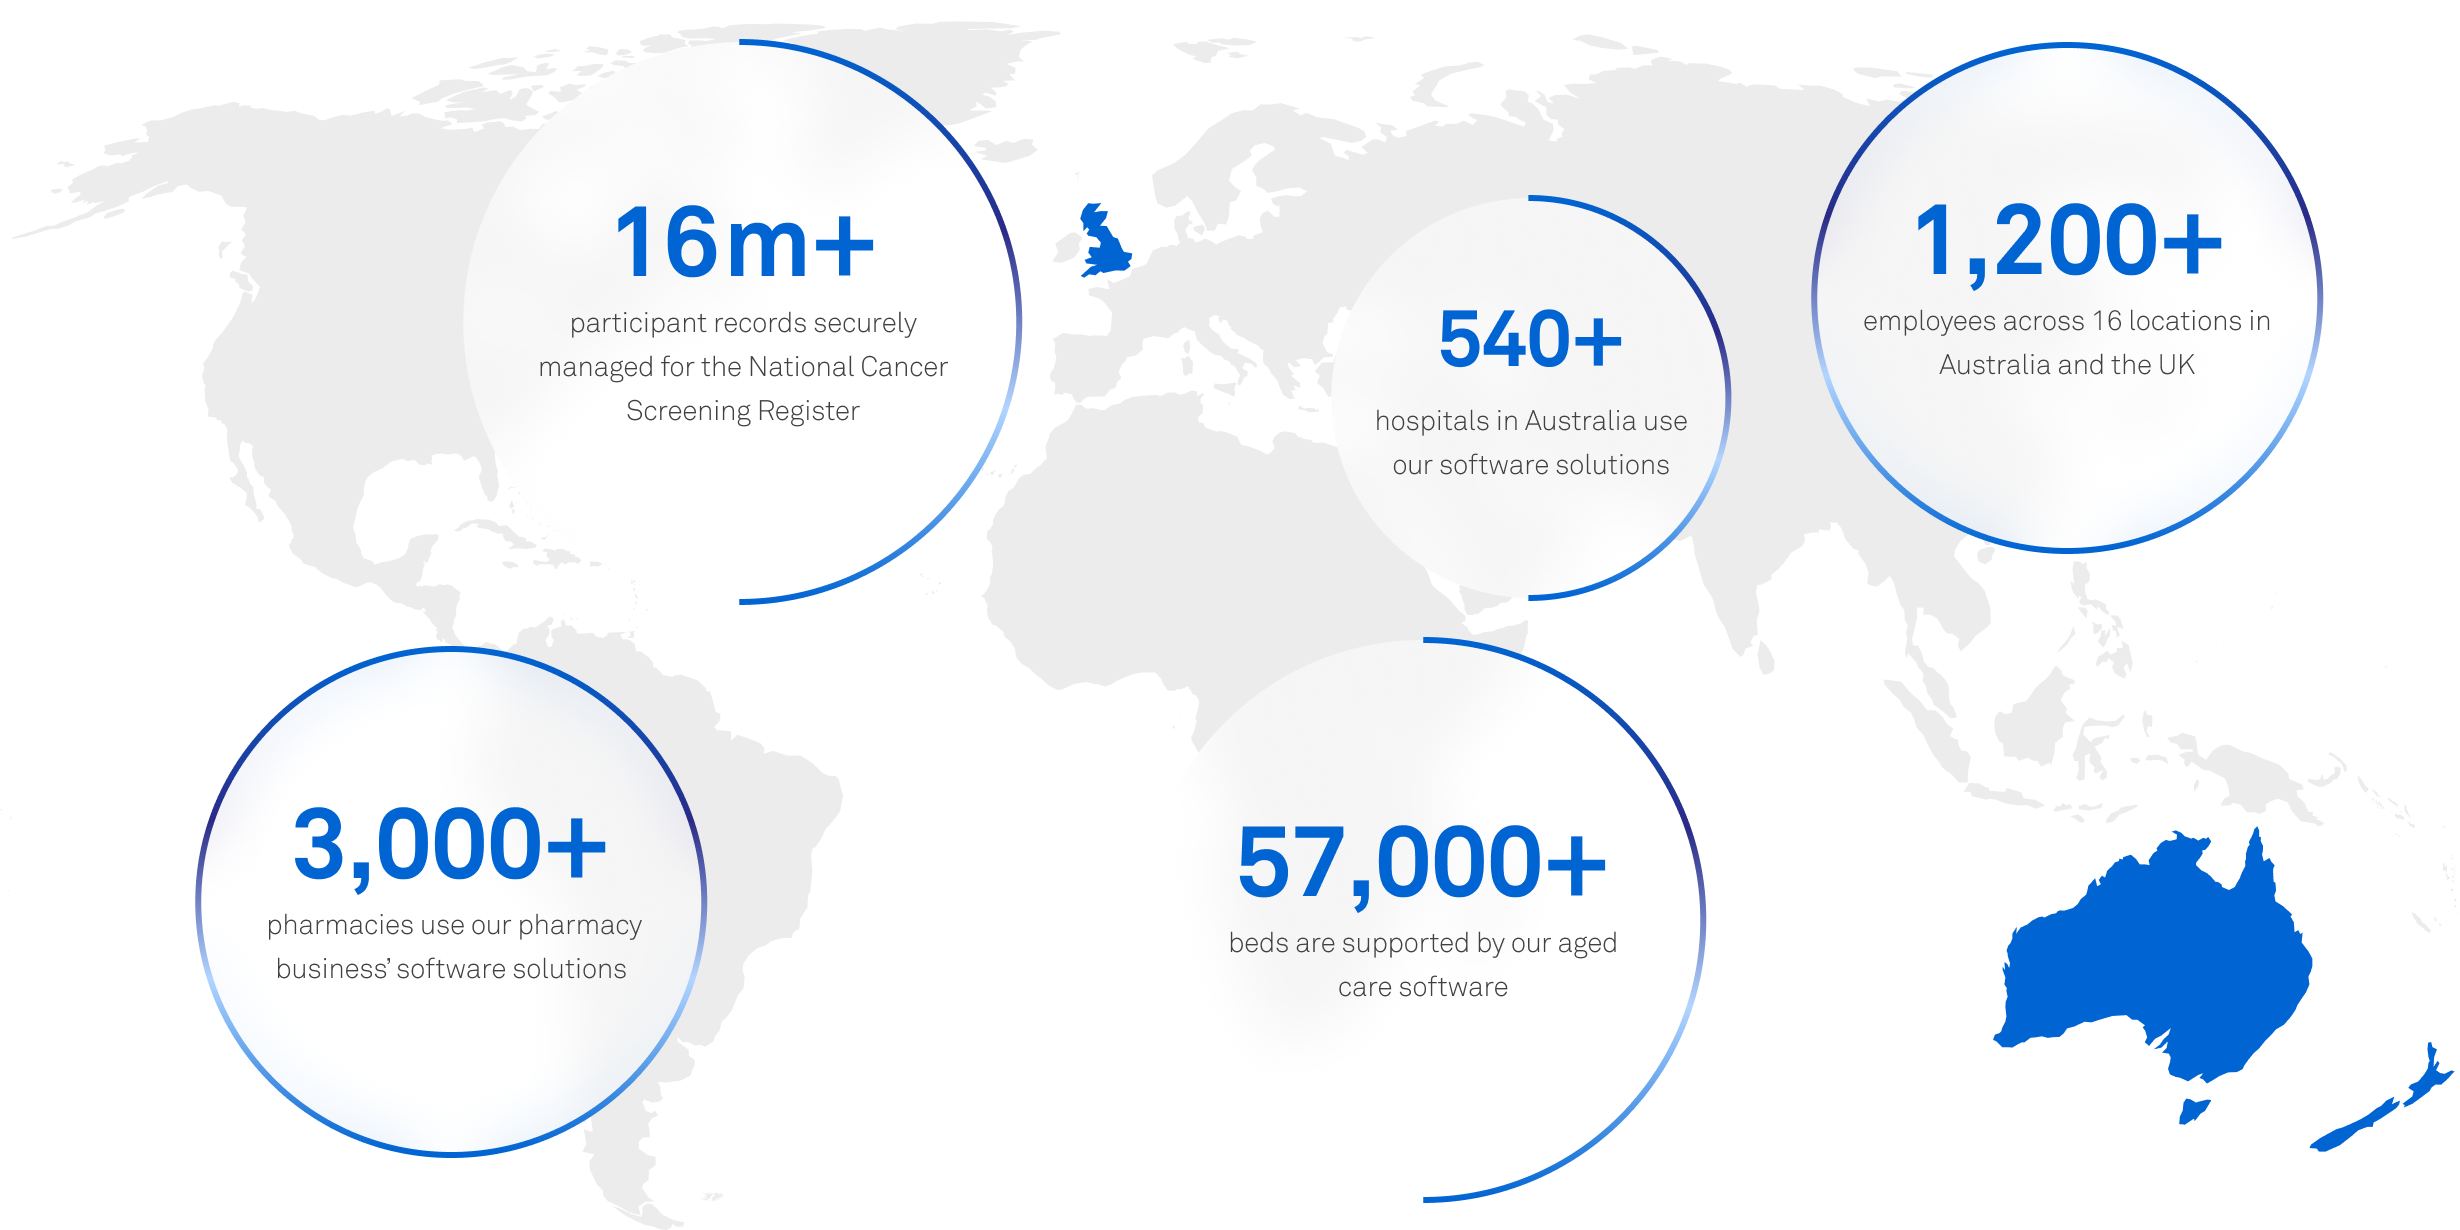
A unique digital footprint across the spectrum of health and aged care
Discover what Telstra Health is doing
Read more news

News
Helix VaxApp gets approval from NHS England to boost vaccine management
29 Mar 2023
...
Tell me more
News
Medical Director UK set to support the next generation of primary care as part of new Tech Innovation Framework
10 Nov 2022
...
Tell me moreInsights
Insight showing the impact of COVID-19 on cancer services must be a catalyst for further research to understand and tackle variation
05 Sep 2022
...
Tell me moreTelstra Health UK equips healthcare organisations to make better and faster decisions on the quality and value of connected healthcare provision. We do this by turning data into insights and insights into decisions.